

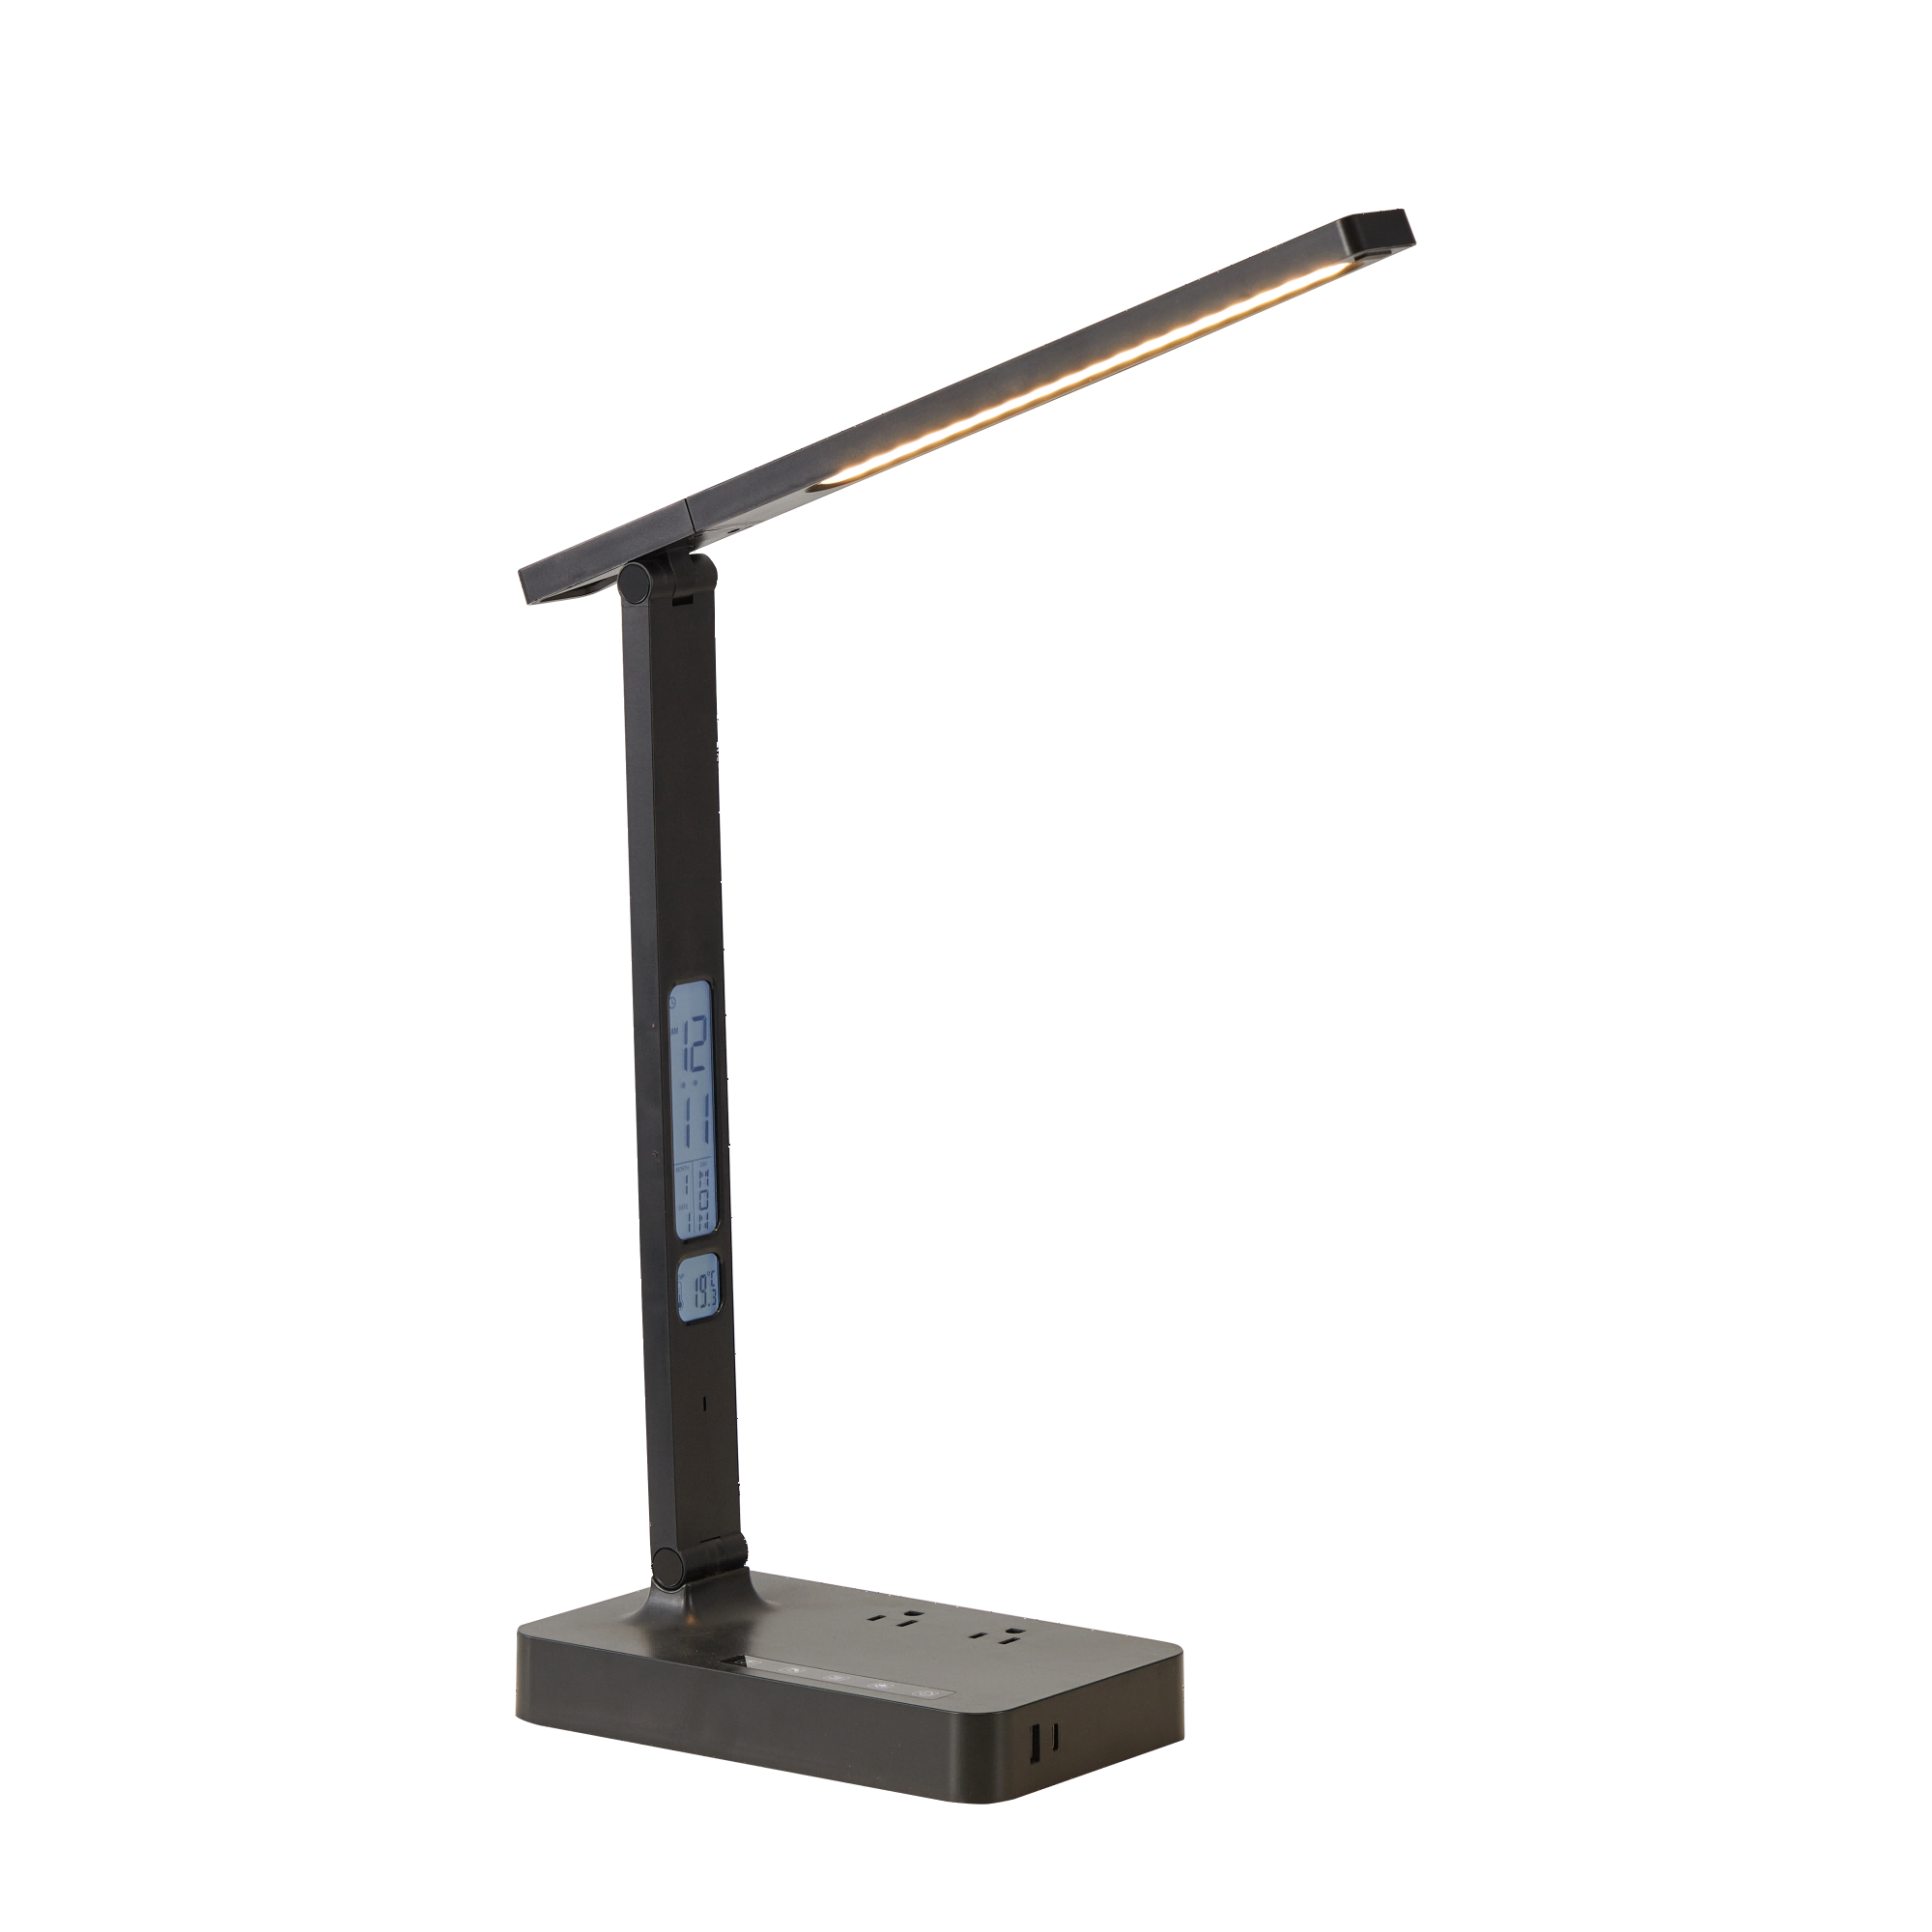
A lamp can make the centre of a desk look bright and still leave the document beside the keyboard in shadow. That is a costly mismatch if your product listing promises a light for the whole workstation.
For wholesale buyers, the useful question is not simply “How many lumens?” It is: “How much light reaches the area our customer actually uses?” Answer that before choosing a model, approving a sample, or putting a coverage claim on the box.
1. Why the brightest point can pick the wrong sample
Lumens describe light output; lux describes light arriving at a surface. The CIE definition of illuminance expresses lux as lumens per square metre. An advertised lumen value cannot tell you desk illuminance without knowing where the light goes.
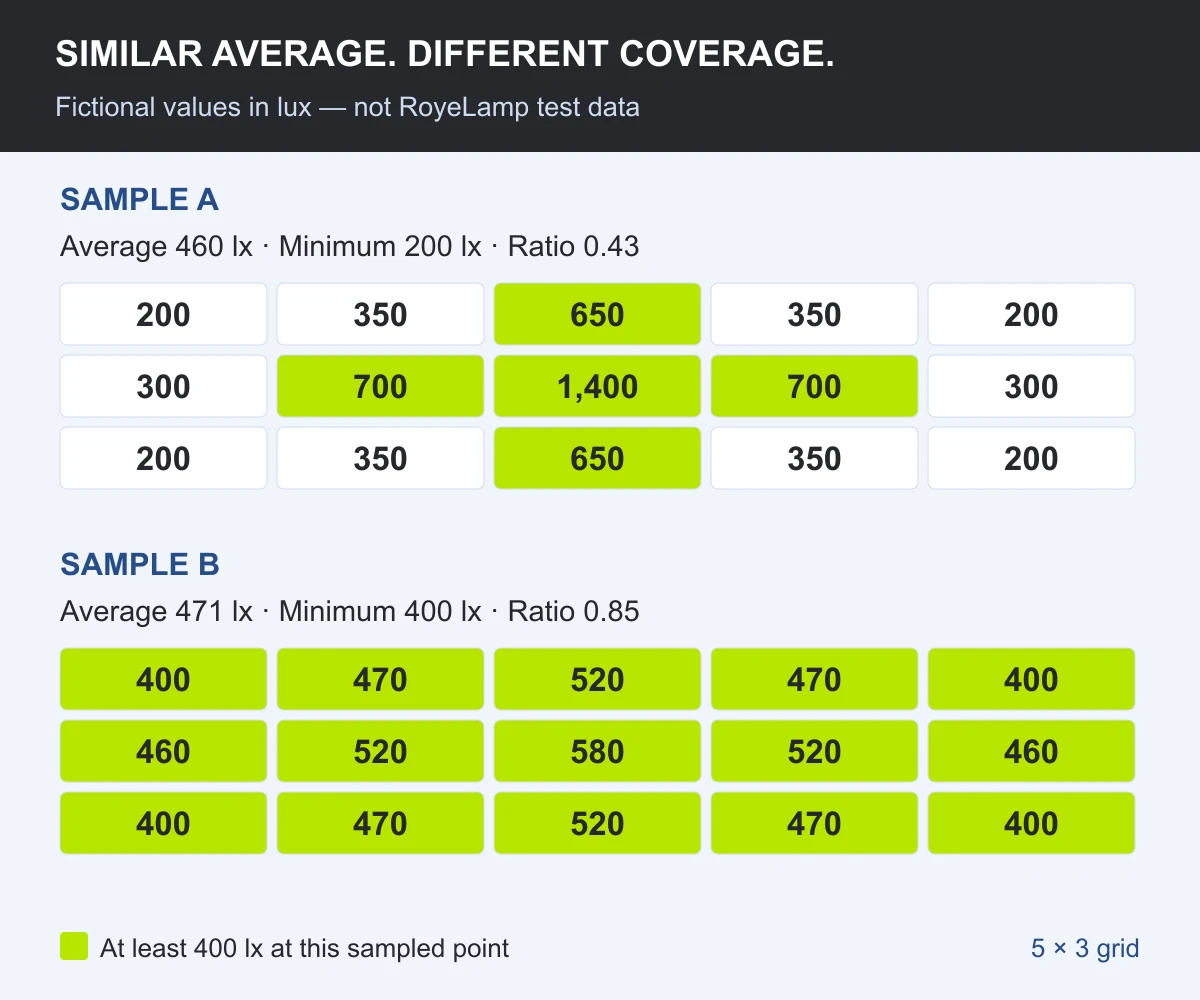
Consider the two fictional maps below. Both use 15 measurement positions across the same desk area. Sample A concentrates much more light in the centre. Sample B spreads the light more evenly.
| Comparison metric | Sample A | Sample B |
|---|---|---|
| Estimated average | 460 lx | 471 lx |
| Lowest sampled value | 200 lx | 400 lx |
| Highest sampled value | 1,400 lx | 580 lx |
| Sampled minimum ÷ estimated average | 0.43 | 0.85 |
| Sample points at or above 400 lx | 5 of 15 | 15 of 15 |
If you bought on centre-point lux, Sample A would win by a wide margin. If you bought on average illuminance, the two would look similar. But the lowest sampled reading in A is only half that of B. A customer moving between a book and notes could encounter a very different lighting experience.
This is why the average needs a companion: the minimum. CIE defines illuminance uniformity as minimum illuminance divided by average illuminance. Applying that relationship to these sampled readings gives about 0.43 for A and 0.85 for B.
These are invented data, not RoyeLamp product measurements. They demonstrate how a bright centre can conceal weak edges. The sampled minimum may miss a darker point between measurements, and a count of passing points is not a percentage of continuous desk area. Good uniformity also does not establish glare control, flicker performance, colour quality, or safety.
See the raw example readings and calculation
| Grid row, left to right | Sample A (lx) | Sample B (lx) |
|---|---|---|
| Far row | 200 · 350 · 650 · 350 · 200 | 400 · 470 · 520 · 470 · 400 |
| Middle row | 300 · 700 · 1,400 · 700 · 300 | 460 · 520 · 580 · 520 · 460 |
| Near row | 200 · 350 · 650 · 350 · 200 | 400 · 470 · 520 · 470 · 400 |
Each point represents an equal-area cell. A totals 6,900 across its lux readings: 6,900 ÷ 15 = 460 lx. B totals 7,060: 7,060 ÷ 15 ≈ 471 lx. The ratios are 200 ÷ 460 ≈ 0.43 and 400 ÷ 470.67 ≈ 0.85. These are grid estimates of the average illuminance over a specified surface.
2. Match the lamp to the task footprint
Define what has to be lit before comparing output. A paperback, an open textbook, and a keyboard with documents on either side are three different briefs. Do not reject a compact lamp for failing a wide-desk test if your customer only needs a small reading area. Equally, do not approve a workstation lamp using a measurement taken over one page.
| Customer's working area | Useful starting point | Question for sample approval |
|---|---|---|
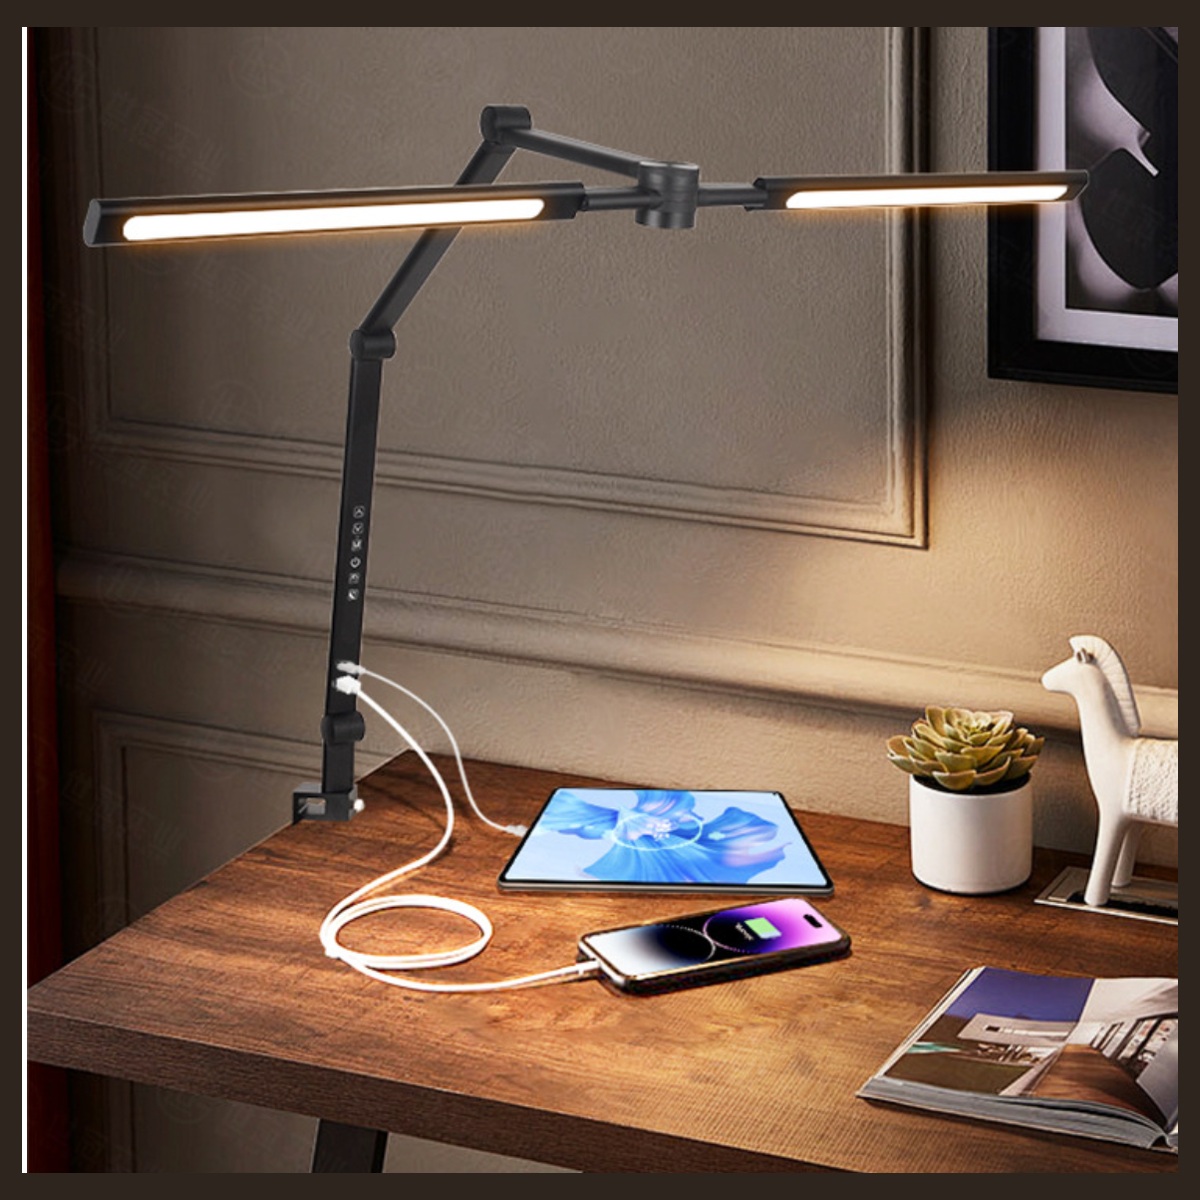
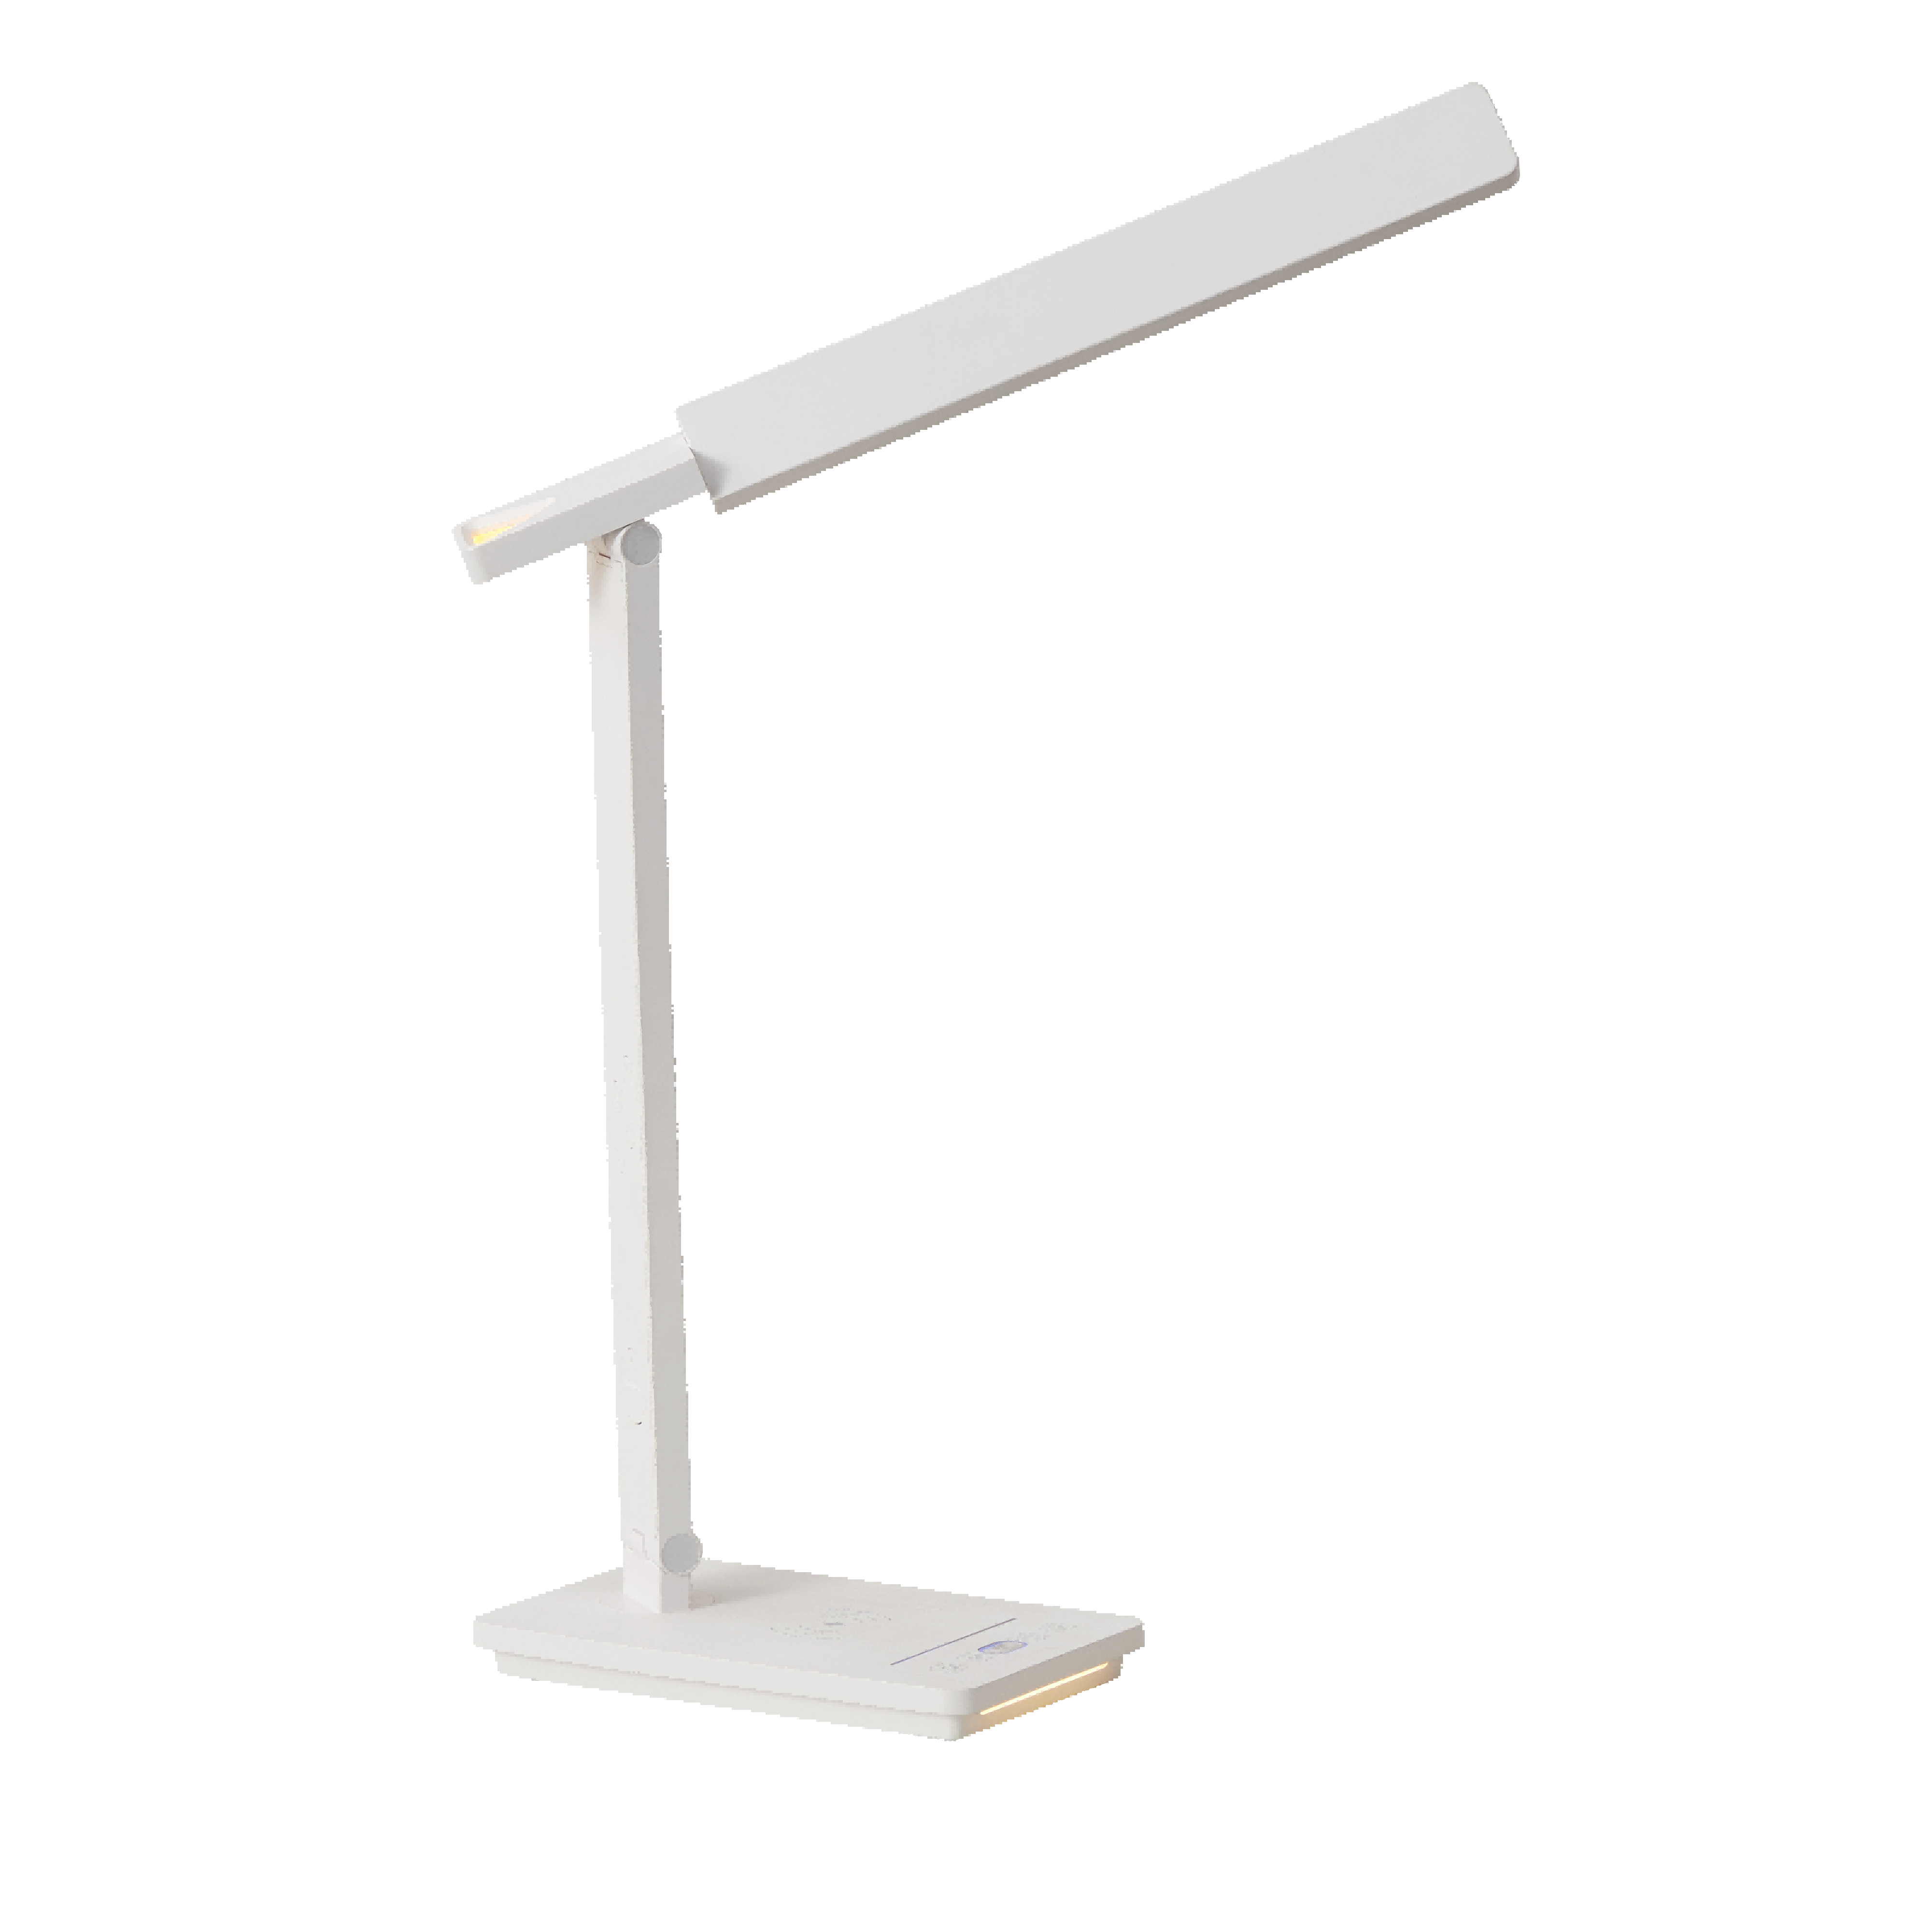
| A book or notebook in a small workspace | A compact adjustable model such as RY26-A, whose supplied design includes three-axis folding | Can the head light both pages without occupying needed desk space? |
| A keyboard with documents spread across a wider desk | A wide-head format such as RY36-C, with a source-stated 800 mm head | Do the far-side documents meet the agreed illuminance at the actual mounting height? |
| A workstation with restricted mounting positions | A format that fits the available edge and monitor clearance | Does coverage still work when the lamp is mounted where the customer can actually install it? |
These are starting points for evaluation, not measured performance rankings. A wide head alone does not guarantee uniform coverage. For RY36-C, also resolve the colour-temperature discrepancy noted on its product page before agreeing the sample settings.
Once a position looks feasible, check it against the clamp compatibility requirements. A good optical result obtained from an impractical mounting position is not a usable product solution.
3. Make suppliers compare the same desk
The most useful test report is one another person can reproduce. Ask both suppliers to use the same task-area drawing and operating conditions. Otherwise, lowering the head or moving the sensor can improve the number without improving the product.
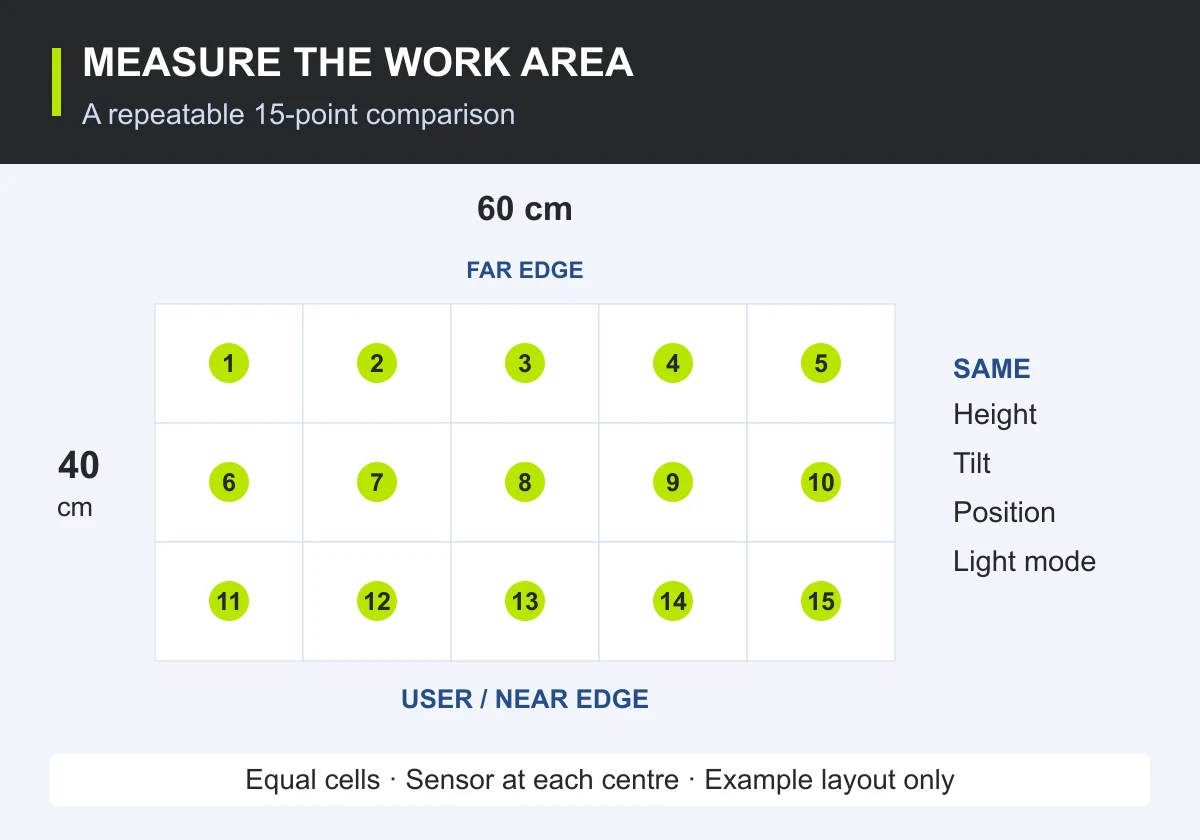
Fix the geometry
A practical starting layout is a 60 × 40 cm rectangle divided into five columns and three rows, with a reading at each cell centre. This is a proposed buyer comparison, not a prescribed standards test. Choose a different area or a denser grid when the intended task requires it.
Mark the user's side, clamp or base location, head angle, and height from the emitting surface to the sensor plane. Measure to the sensor, not automatically to the desktop: the instrument may raise the measurement plane. Keep the sensor horizontal and keep hands and the operator's body from shading it.
Check critical edges and visible transitions between bright and dark zones separately. Do not mix extra edge points into an equal-cell average without accounting for area weighting.
Fix the operating conditions
Identify the sample revision, adapter, cable, colour mode, brightness level, and any connected charging load. Agree a stabilization procedure and record the elapsed operating time and room conditions. Compare the settings your customer will use, not only the single mode with the highest output.
For a lamp-to-lamp comparison, keep background light negligible or use a documented correction method. For an installed-workspace assessment, measure the lamp and room lighting together. Label those results separately. If daylight changes during a run, repeat under controlled conditions rather than subtracting one convenient background reading from the whole map.
Make the evidence repeatable
Ask for the raw point readings, setup photograph, instrument details, calibration status, and relevant measurement uncertainty. ISO/CIE 19476:2014 addresses illuminance-meter performance and recognizes that accuracy depends on the source and operating conditions as well as the instrument. Use a competent laboratory when contractual claims require a formal method.
After the controlled measurements, review the actual workstation with its monitor, documents, and typical seated viewpoints. Check reflections, exposed bright emitters, and hand shadows. Record these observations separately; a lux map cannot answer every lighting-quality question.
4. Turn the map into a purchase decision
A report becomes useful when it changes what you approve. Agree the required area, settings, average illuminance, lowest acceptable readings, and uniformity before testing. Choose the limits for the intended task and applicable requirements; there is no single lux value in this guide that approves every desk lamp.
For illustration only, imagine an agreement requiring an average of at least 450 lx, every grid point at least 300 lx, and a sampled minimum-to-average ratio of at least 0.60. Sample A would meet the average but miss the other two conditions. B would meet all three nominal limits. Formal acceptance would still follow the agreed treatment of measurement uncertainty.
Use the pattern of results to decide what happens next:
- Average passes, edges fail: review the light distribution, mounting position, or selected lamp format. Do not solve the problem by measuring a smaller area than the customer needs.
- The whole area falls short: first verify the supply and settings, then reconsider output and geometry.
- The map passes, but screen reflections are unacceptable: revisit head angle, shielding, and layout; more lux is not the remedy.
Please evaluate the lamp over our attached task-area drawing using the agreed mounting position, sensor-plane height, supply, colour mode, and brightness level. Provide a setup photograph and raw point readings for each identified sample, plus estimated average, lowest reading, and sampled uniformity. State background-light conditions, stabilization procedure, instrument details, and relevant uncertainty. Agree acceptance limits and the pass/fail decision rule with us before testing.
Attach the approved drawing and report to your golden-sample record. Define how production units will be selected for checking and what happens after a failed result; the pre-shipment inspection checklist can carry those requirements. Keep original readings and consistent rounding rules, especially near an acceptance limit.
Recheck relevant performance after changes to the LED, diffuser, optical geometry, drive settings, power supply, or tested mechanical positions. An approved map belongs to a defined configuration, not every product sold under the same model name.
Questions buyers often ask
Can I convert advertised lumens into desk lux?
Not from lumens alone. Dividing total lamp lumens by desk area assumes the light reaches that area in a way the specification has not established. Request a map or suitable distribution data for the actual setup.
Can we compare lamps at different heights?
Yes, when evaluating how each will be installed, but state the difference. For a controlled comparison, use the same agreed geometry. Never present a low-mounted sample and a high-mounted sample as identical test conditions.
Is a phone lux app enough for approval?
Not without evidence that the method is suitable and its uncertainty is understood for the sources and geometry involved. Use an appropriate calibrated illuminance meter for contractual evidence.
Does a uniform map support an “eye-care” claim?
It supports a specific statement about spatial illuminance under stated conditions. It does not establish health benefits, absence of glare, flicker performance, colour quality, or optical and electrical safety.
Send the desk layout with your next enquiry
Tell RoyeLamp the working-area width and depth, available mounting position, intended tasks, and required power and light settings. That gives us a concrete basis for discussing candidate models and the sample evidence you need.
Definitions and instrument guidance are linked to CIE and ISO sources where used. Product details were checked September 9, 2026. Both diagrams, datasets, the 15-point layout, and numerical acceptance limits are editorial examples, not product test results or quoted standards requirements.
